It was reported on RenewEconomy (and discussed on twitter), that the combined South Australian Regional Solar (i.e. the sum of Utility and Rooftop PV) reached a record share of 80% of the SA Combined Demand (i.e. the sum Grid Demand and Rooftop PV) on Sat 12 Oct 2019.
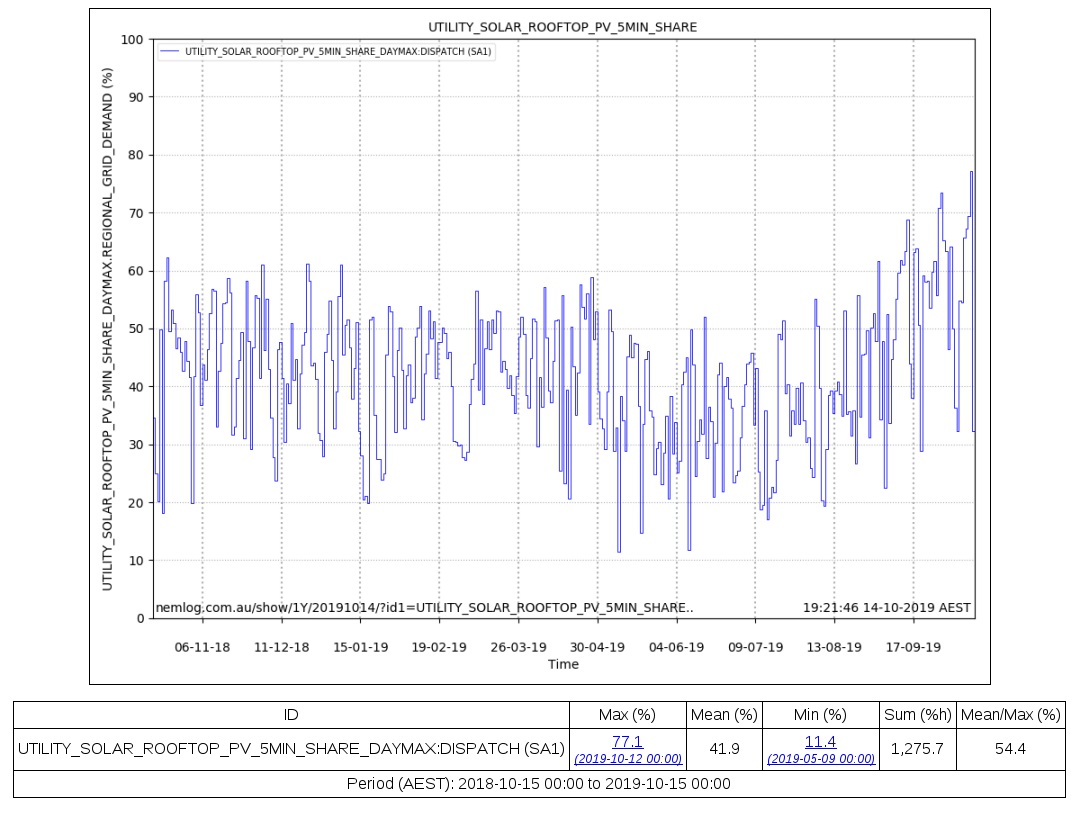
Looking at this in a bit more detail at NEMLog we can see the Maximum of Daily Maximum Combined Solar Share's for the Year up to Mon 14 Oct 2019 are shown in Figure 1 below. The table below graphs shows the SA Maximum Daily Combined Solar Share was indeed recorded on Sat 10 Oct 2019 at 77.1%. The slight difference in this value to the OpenNEM value of 80%, would most likely be attributed to the Rooftop PV measurement used as there are a few to choose from.
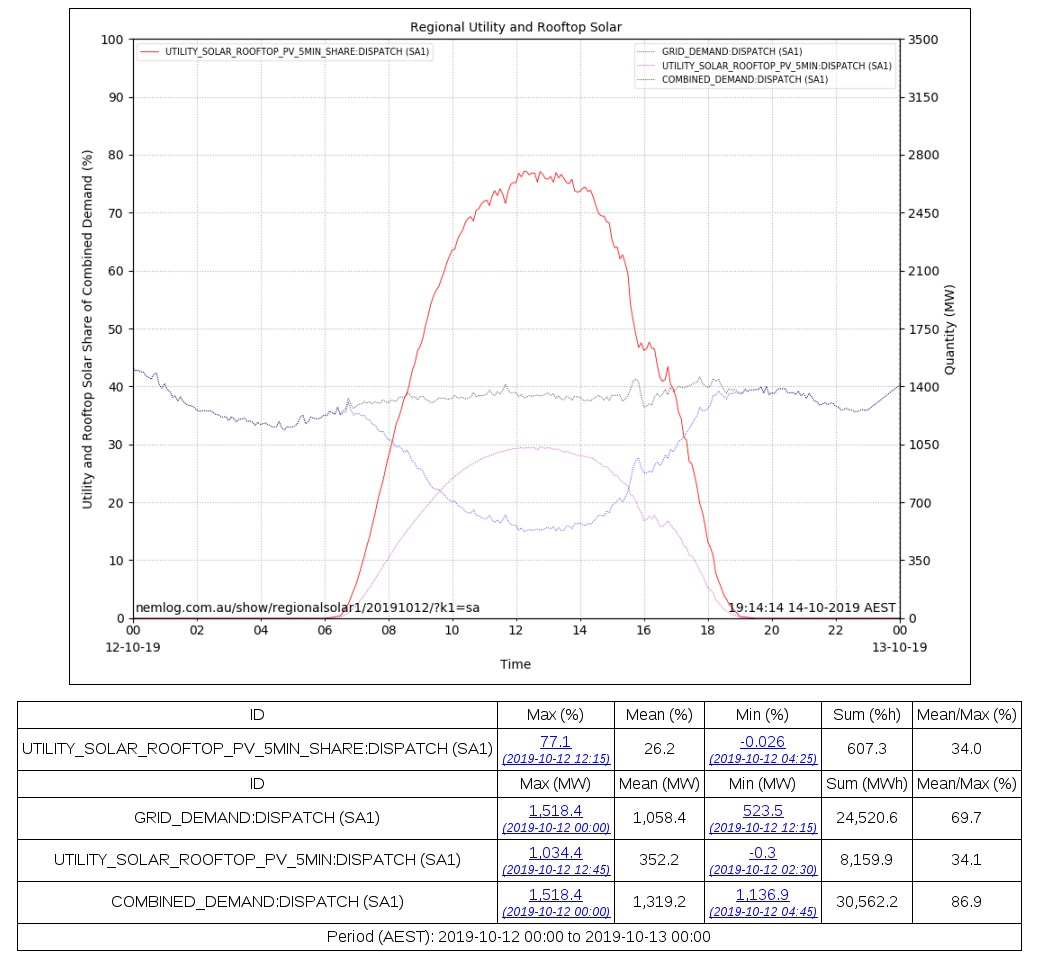
We can now look at Sat 12 Oct 2019 in more detail as shown in Figure 2 below.
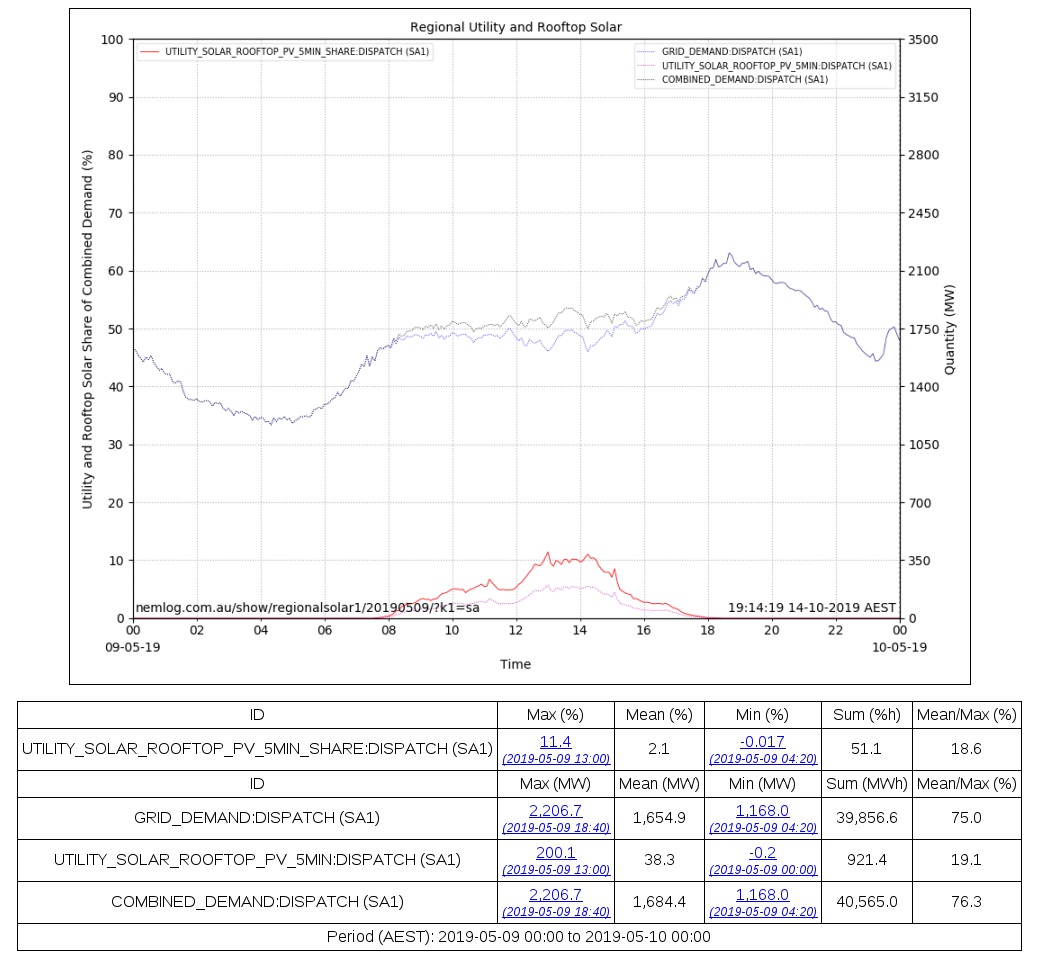
Whenever we look at record maximum values, it is instructive to look at the record minimum over the same period. In this case the table below Figure 1 shows a Minimum of Daily Maximum Combined Solar Share of 11.4% on Thu 09 May 2019. We can see this day in more detail in Figure 2.
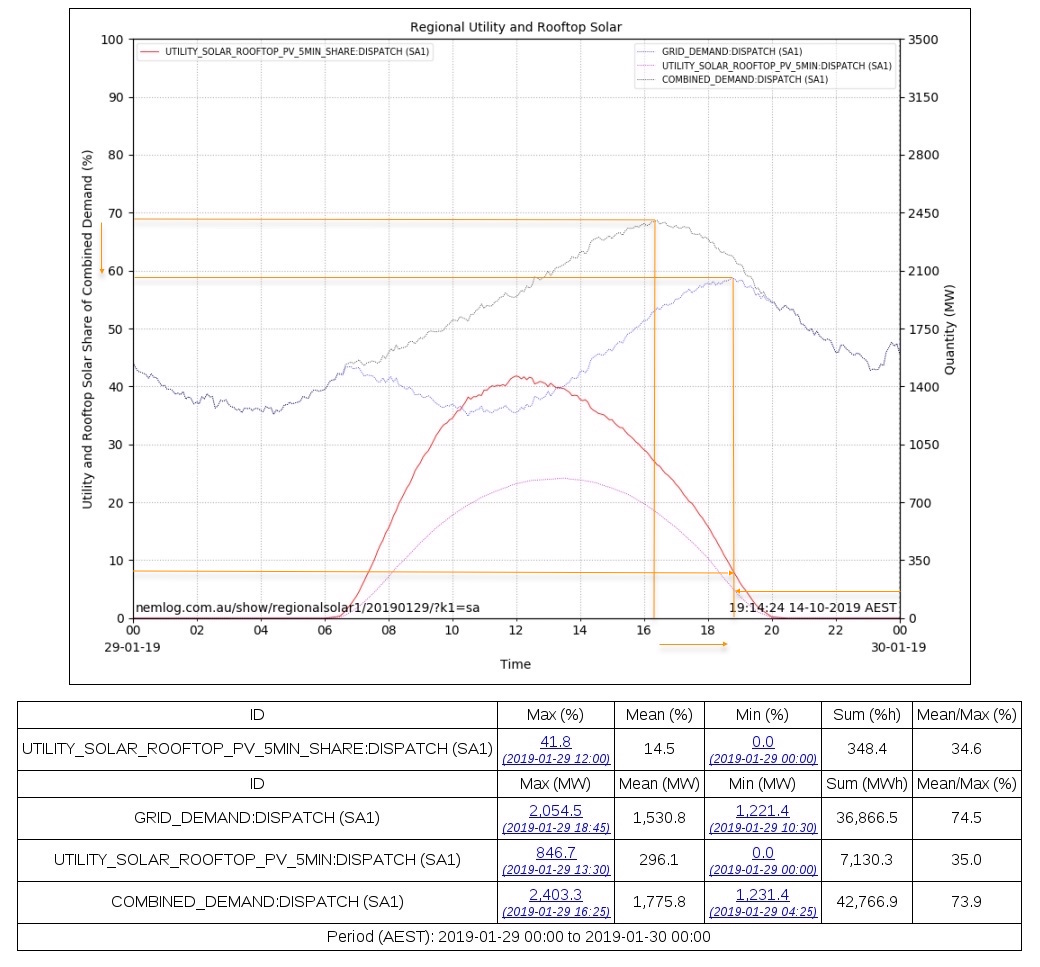
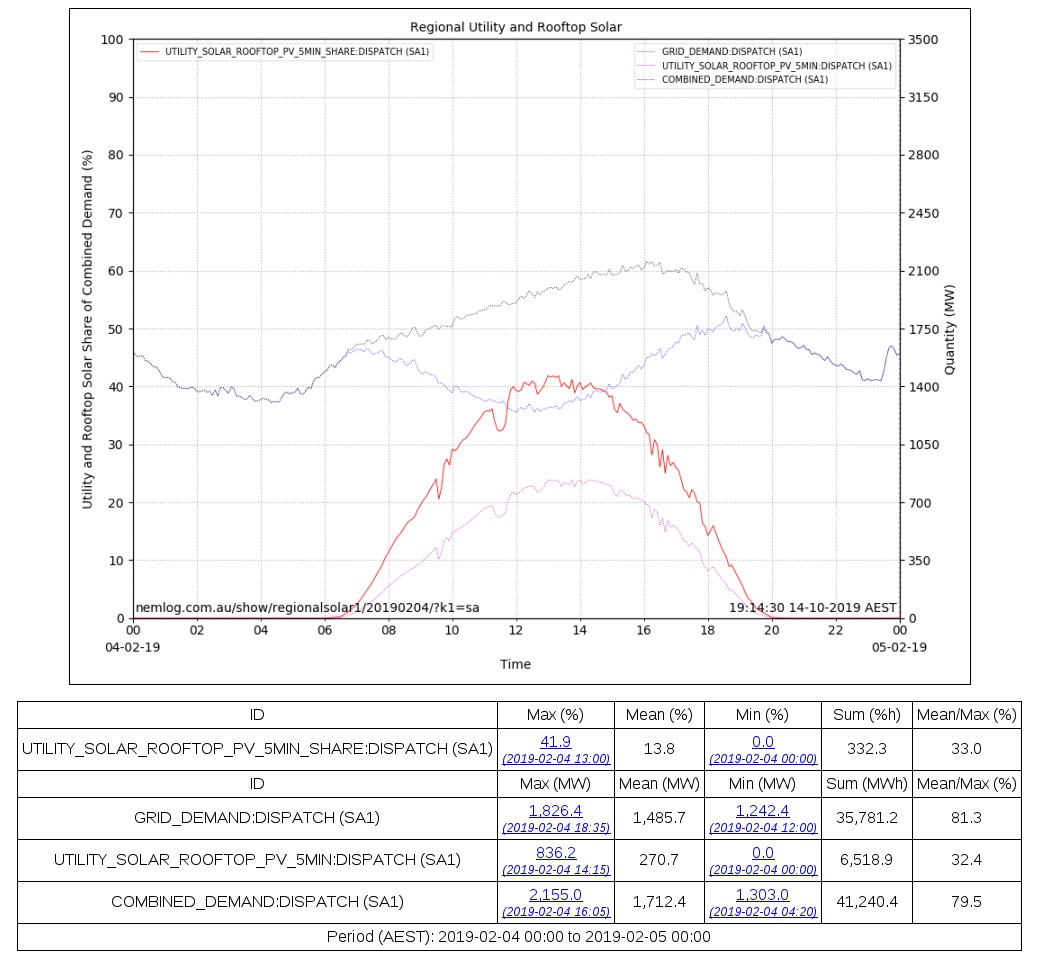
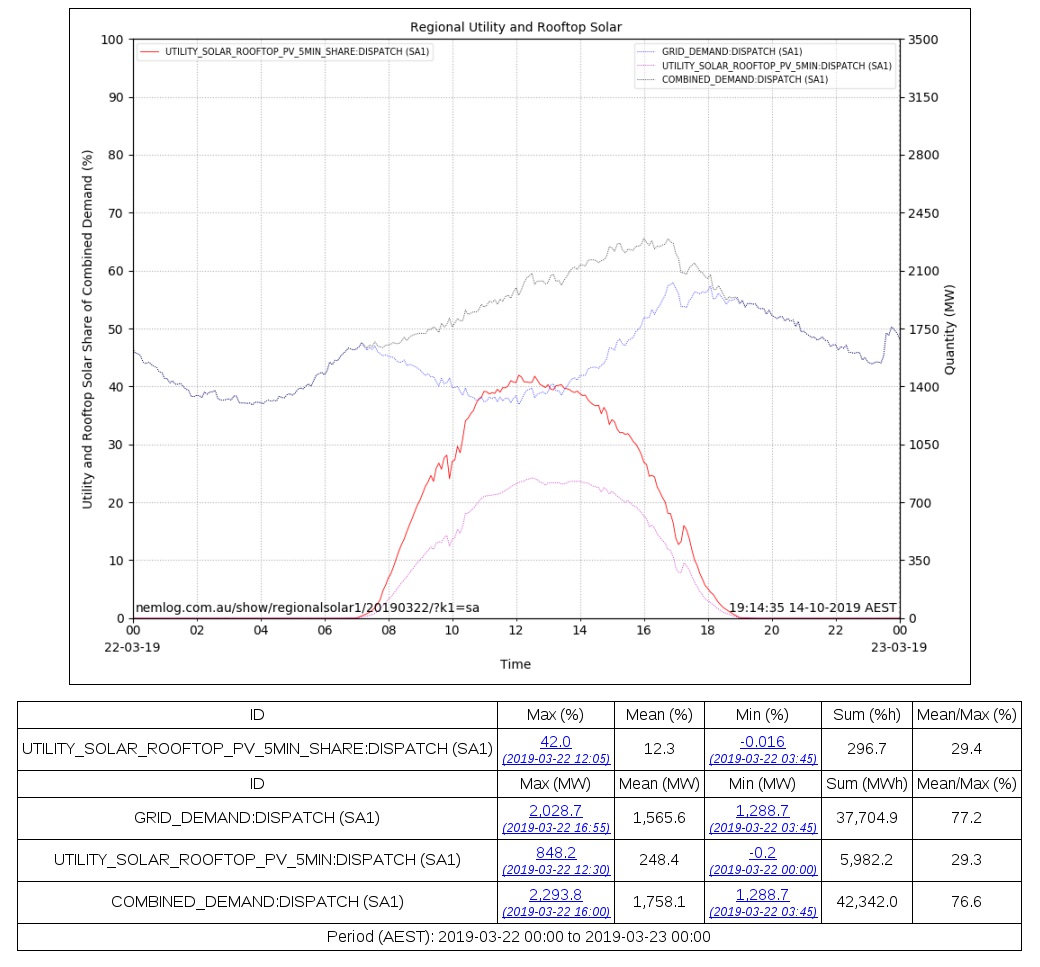
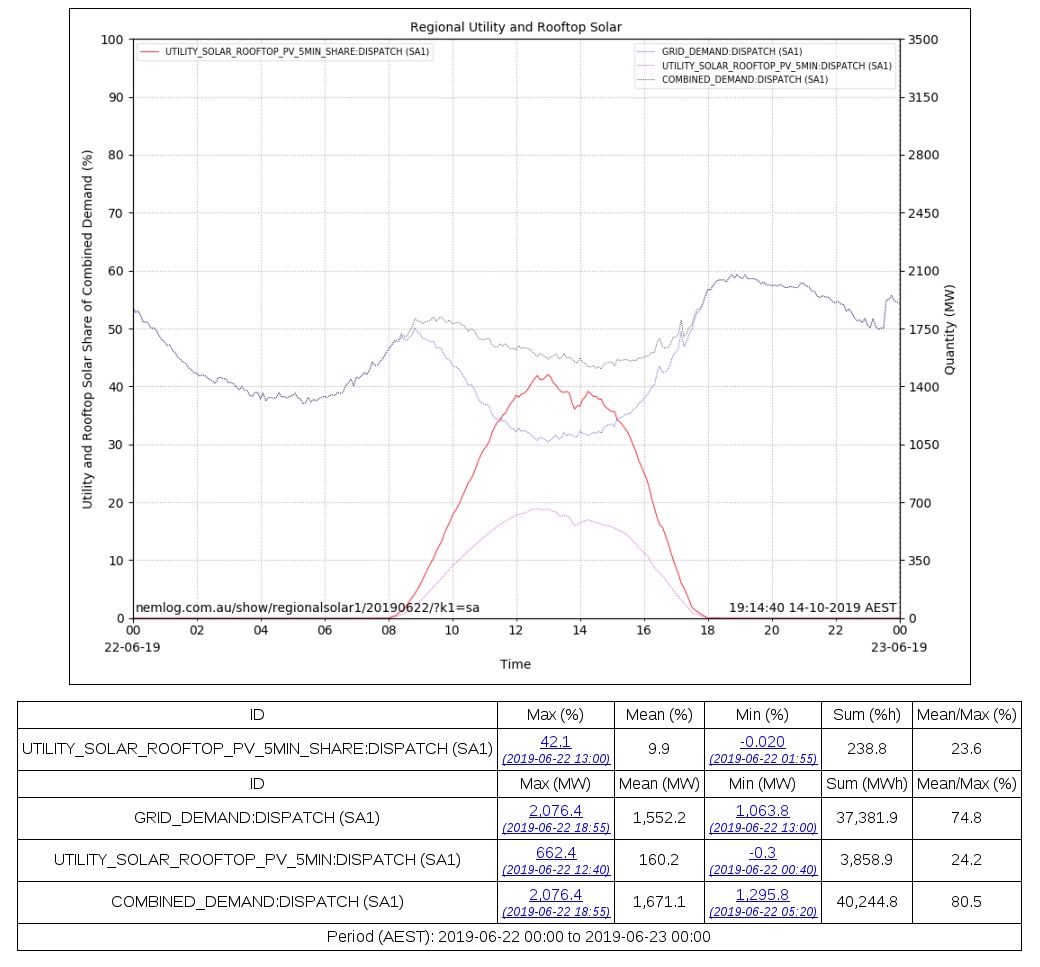
It is also worth looking at the days of Average Daily Maximum Combined Solar Shares. In this case it is around 41.9% and a number of days - Tue 29 Jan 2019, Mon 04 Feb 2019, Fri 22 Mar 2019, Sat 22 Jun 2019, - around this average value are shown in Figure 3.
The growth of the Combined Solar has changed the nature of the Grid Demand in summer. The graph for Tue 29 Jan 2019 has been annotated to show this change. We can see that Combined Solar has lowered the peak Grid Demand and has delayed the time of it's occurrence. In this case, the combined solar contribution at time of peak is approximately 20% of that at the peak.
All three figures demonstrate the range of variation of the Daily Share of Regional Combined Solar to Regional Combined Demand. It also highlights the challenges in meeting this variation.
|
|
|
 |
 |