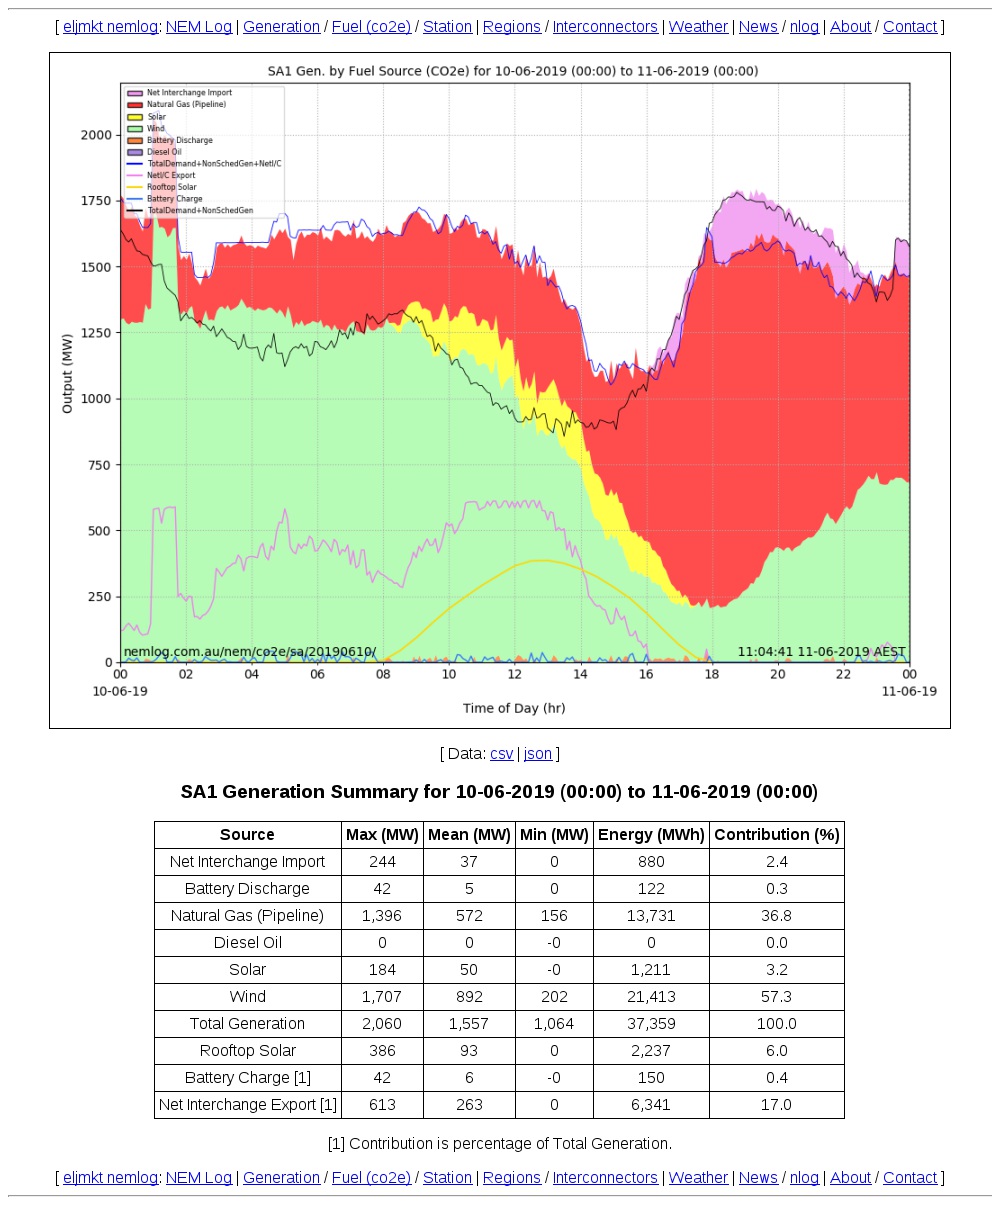
On Mon 10 Jun 2019, SA Wind recorded an all time maximum instantaneous output of 1,707 MW at dispatch interval 00:55 hrs. The previous record was 1,652 MW on Wed 04 Jul 2018.
At the time, there were interventions in the SA Market, with AEMO directing the operation of SA Gas Units to maintain system security and strength.
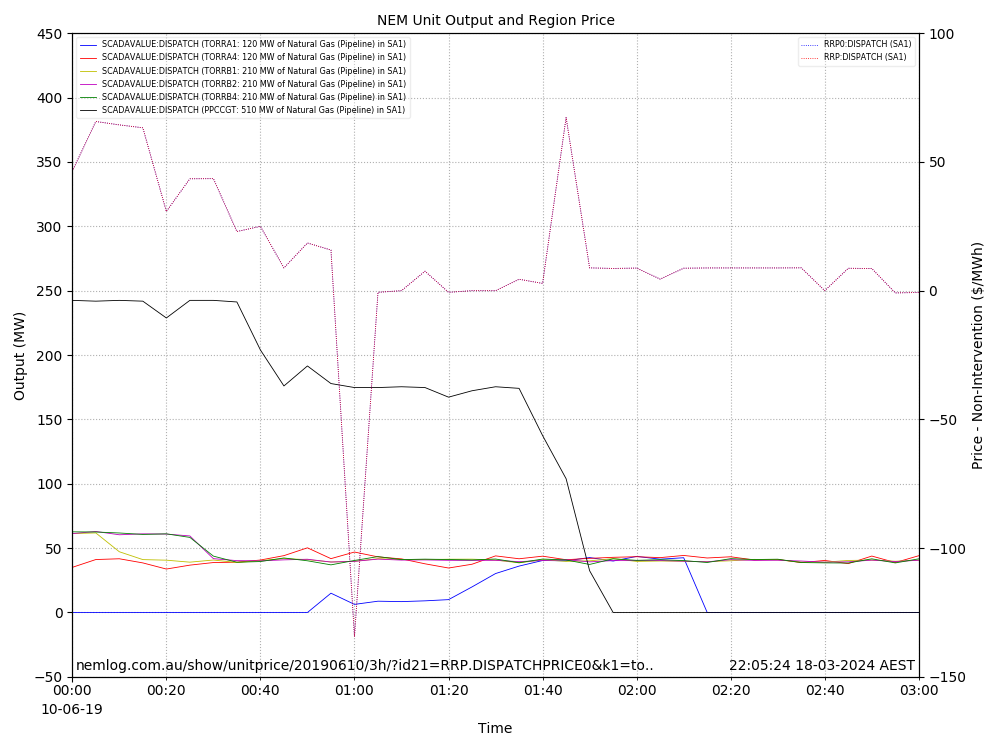
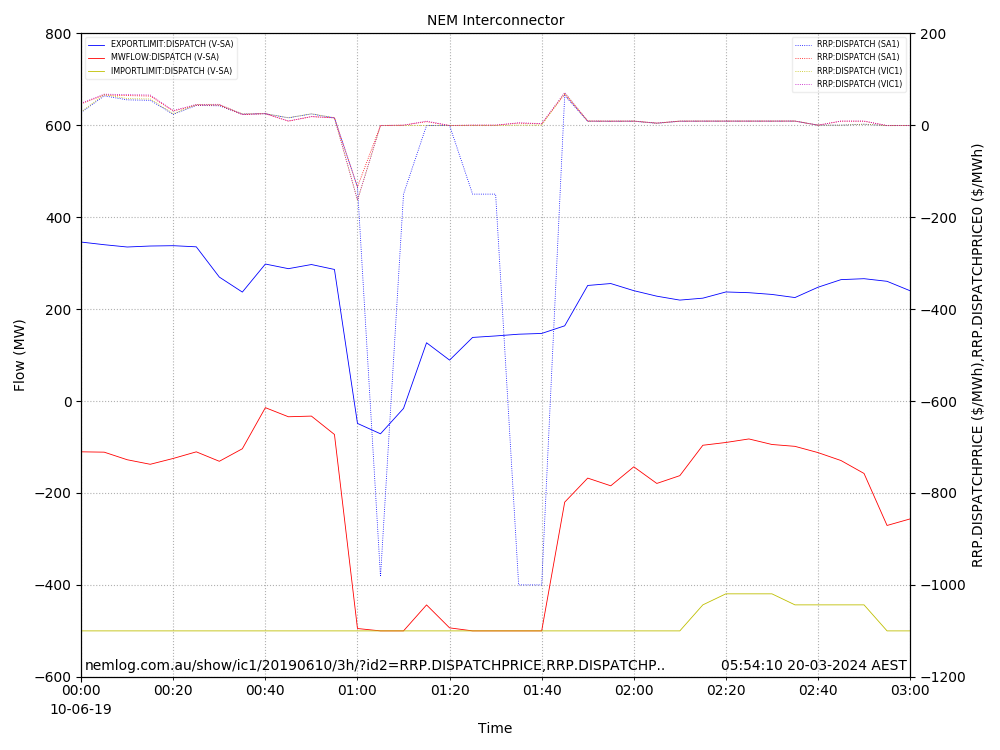
The following graph shows the SA Gas Units that operated (non-zero output) in the period 00:00 to 03:00 on Mon 10 Jul 2019 (link). The graph also shows the SA Dispatch Price with the intervention (dotted blue line) and without (dotted red line) [1]. The Torrens Island A1 120 MW Gas Unit (TORRA1 solid blue line) returned to service at 00:50 (the unit output times are 5 mins ahead of the dispatch interval times by convention). At this time there were 6 SA Gas Units in-service until the Pelican Point Unit (PPCCGT - black line) went off-line at 01:50 hrs.
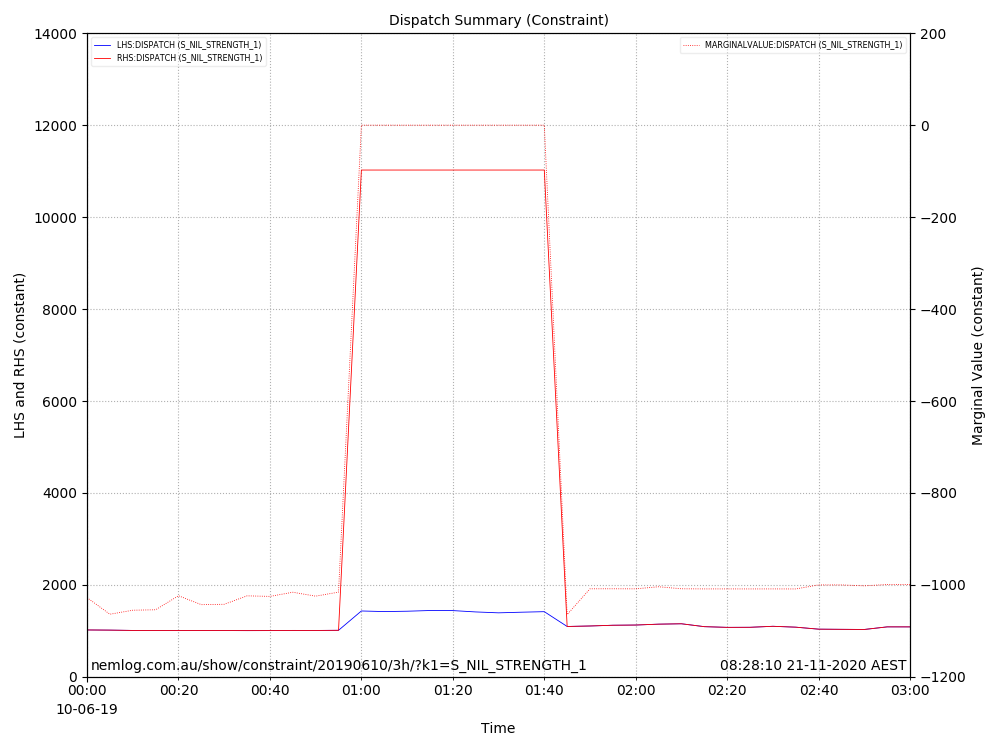
AEMO manage the security of the system through constraints that are applied to the NEM Dispatch Engine (NEMDE) [see Transfer Limit Advice - South Australian System Strength]. There are two constraints for SA System Strength. They are: identified as S_NIL_STRENGTH_1 and S_NIL_STRENGTH_2 One of the constraints for SA System Strength is S_NIL_STRENGTH_1. The latest descriptions accessible, describe these constraint as:
S_NIL_STRENGTH_1 - Upper limit (1460 to 1295 MW) for South Australian non-synchronous generation for minimum synchronous generators online for system strength requirements. Automatically swamps out when required HIGH combination is online.
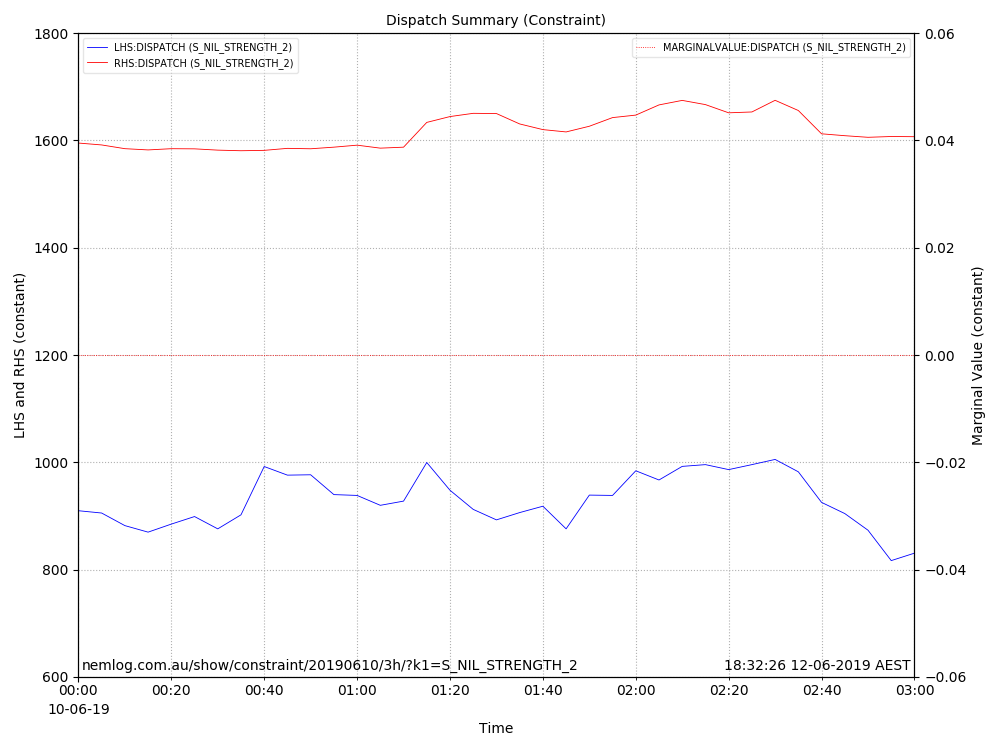
S_NIL_STRENGTH_2 - Maximum limit (1870 MW + Vic to SA on Heywood) for South Australian non-synchronous generation for higher number synchronous generators online for system strength requirements.
The following graph shows the S_NIL_STRENGTH_1 and S_NIL_STRENGTH_2constraints in more detail. When a constraint is binding, the LHS (left side of the constraint equation) equals the RHS (right hand side) and the Marginal Value moves off zero. These constraints have many terms and is dependent on the number of SA Gas Units in operation. When the TORRA1 Gas Unit returns to service, the S_NIL_STRENGTH_1 moves to non-binding and the S_NIL_STRENGTH_2 remains non-binding. This has the result of allowing more SA Wind to be dispatched if available.
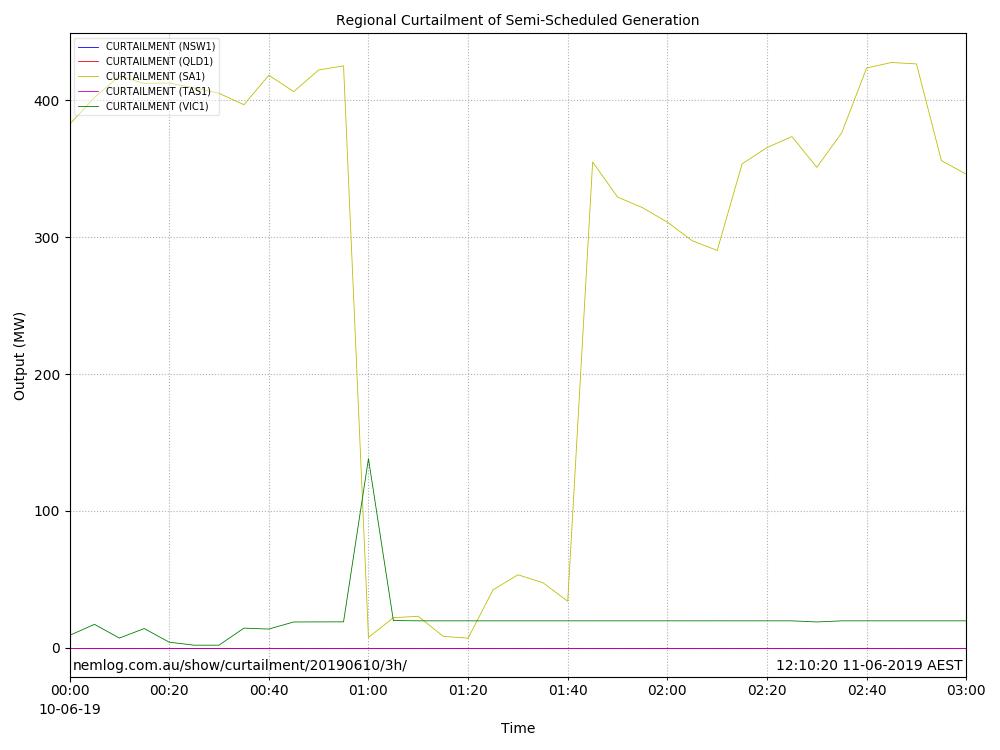
While the S_NIL_STRENGTH_1 constraint was binding, there was approximately 430 MW of curtailed SA Wind (i.e. available but not dispatched by NEMDE) as shown in the following graph:
With S_NIL_STRENGTH_1 constraint not binding, this provided the opportunity to dispatch the curtailed SA Wind output. At this time Heywood interconnector between Victoria and SA had the ability to handle this wind output, which was dispatched at a price close to the market floor of -$1,000 /MWh, as shown in the following graph:
With 430 MW of SA Wind being exported to Vic, this was a significant change in generation and had impact on generation across the NEM. The following graph shows the Vic Brown Coal Station Output over the 3 hour period:
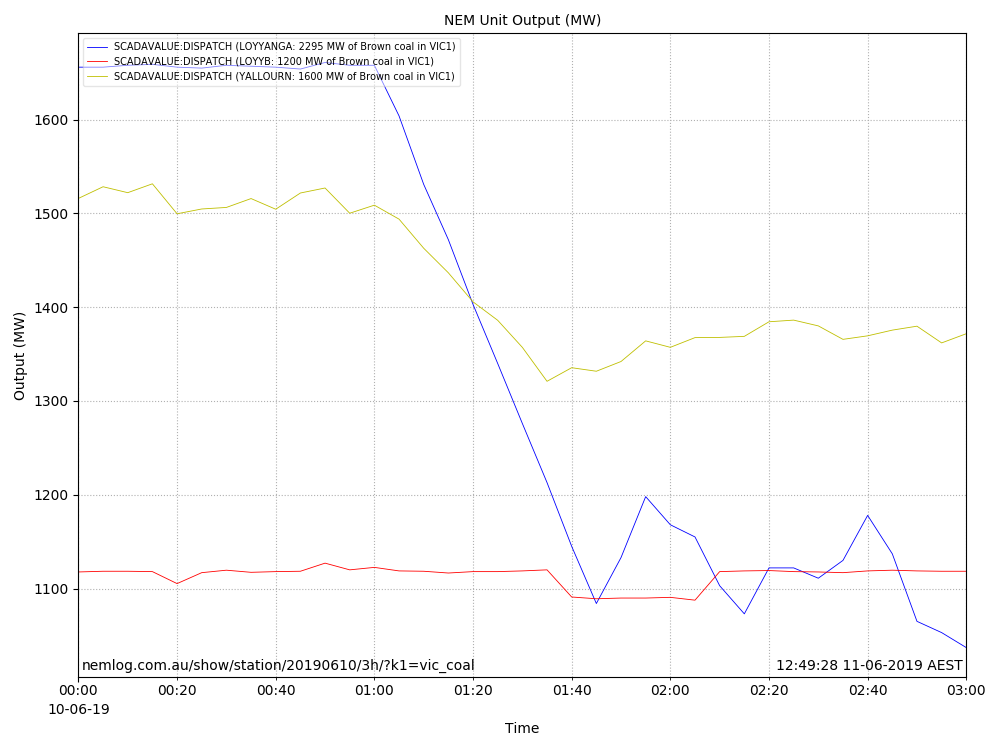
The Loy Yang A Station (LOYYANGA - solid blue line) reduced output along with the Yallourn Station (YALLOURN - solid yellow line) over the period the S_NIL_STRENGTH_1 constraint was not binding (i.e. from the time there were 6 SA Gas Units in-service).
The impact of the operation of one small Gas Unit in SA (Torrens Island A1 120 MW Gas Unit), had a major impact on NEM outcomes over the period of an hour - the Butterfly Effect.
[1] AEMO dispatch according to the Intervention (and the resulting Prices) but settle on the non-intervention price.
Yes, lately AGL's been using TIPS to cover the loss of LYA2. Additional TIPS units online remove the inertia constraint maximising wind dispatch driving exports to Vic (rather than using more expensive Vic OCGT's). It's still contingent on local demand+export capacity though.
Josh Sundqvist (@quiet_101) June 11, 2019